Your data platform has 15 incidents per month. Is that normal or a crisis? Here'
Your data platform has 15 incidents per month. Is that normal or a crisis? Here’s the benchmark.
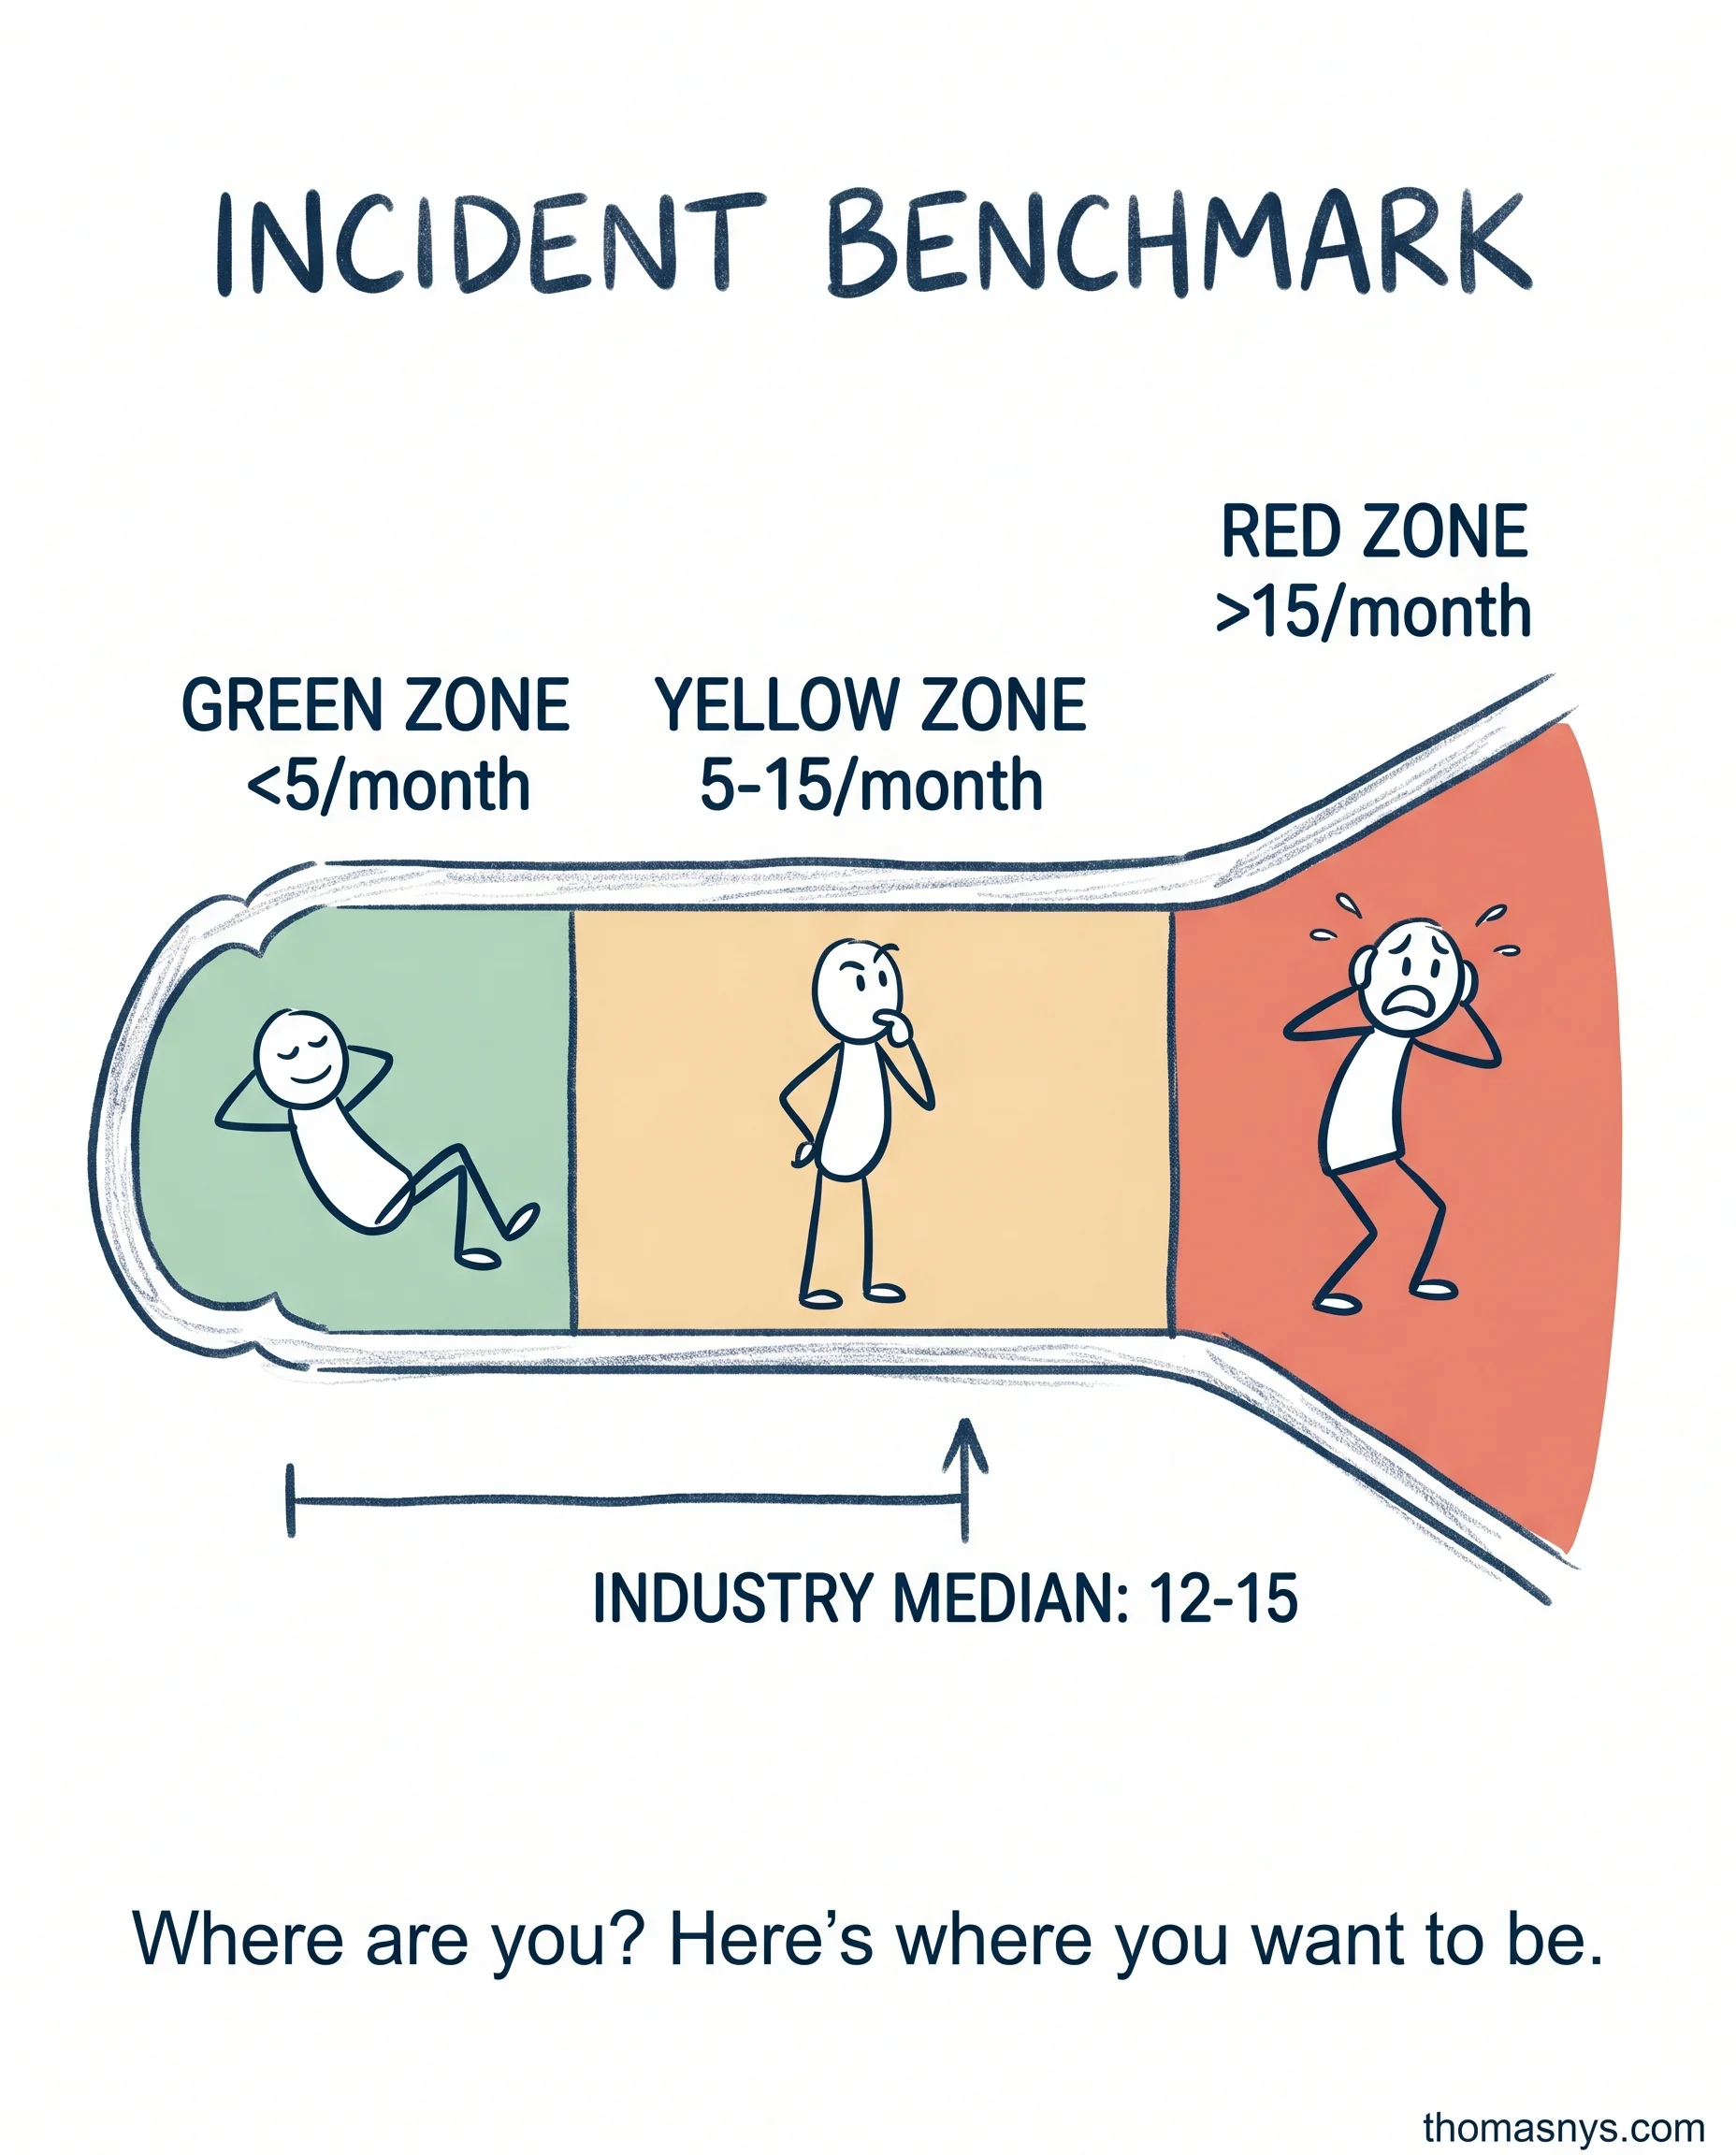
Industry median: 12-15 data incidents per month for a 50-person company.
Most teams have no idea if that’s good or bad. They just live in it.
Here’s the benchmark. Green zone: less than 5 per month. Mature platform, good practices, systems working. Yellow zone: 5-15 per month. Industry average. Room for improvement, but not a crisis. Red zone: more than 15 per month. Firefighting mode. Architectural issues or process failures.
Most incidents follow the same pattern: schema changes break downstream pipelines. Data quality issues surface late. Infrastructure failures cascade. Nobody owns the fix until it’s an outage.
The target: less than one critical incident per month. Not zero - zero is impossible. But one is achievable.
Start with measurement. Count your incidents. Categorize them (schema, quality, infrastructure, human error). See the pattern. Most teams find the same three culprits repeatedly. Fix those three, you cut incidents 60%.
How many data incidents did your team handle last month? Which category did most fall into?
Fractional Data Architect helping startups and scaleups build data platforms that scale.
More about Thomas Nys →