The Rebuild Cost Curve
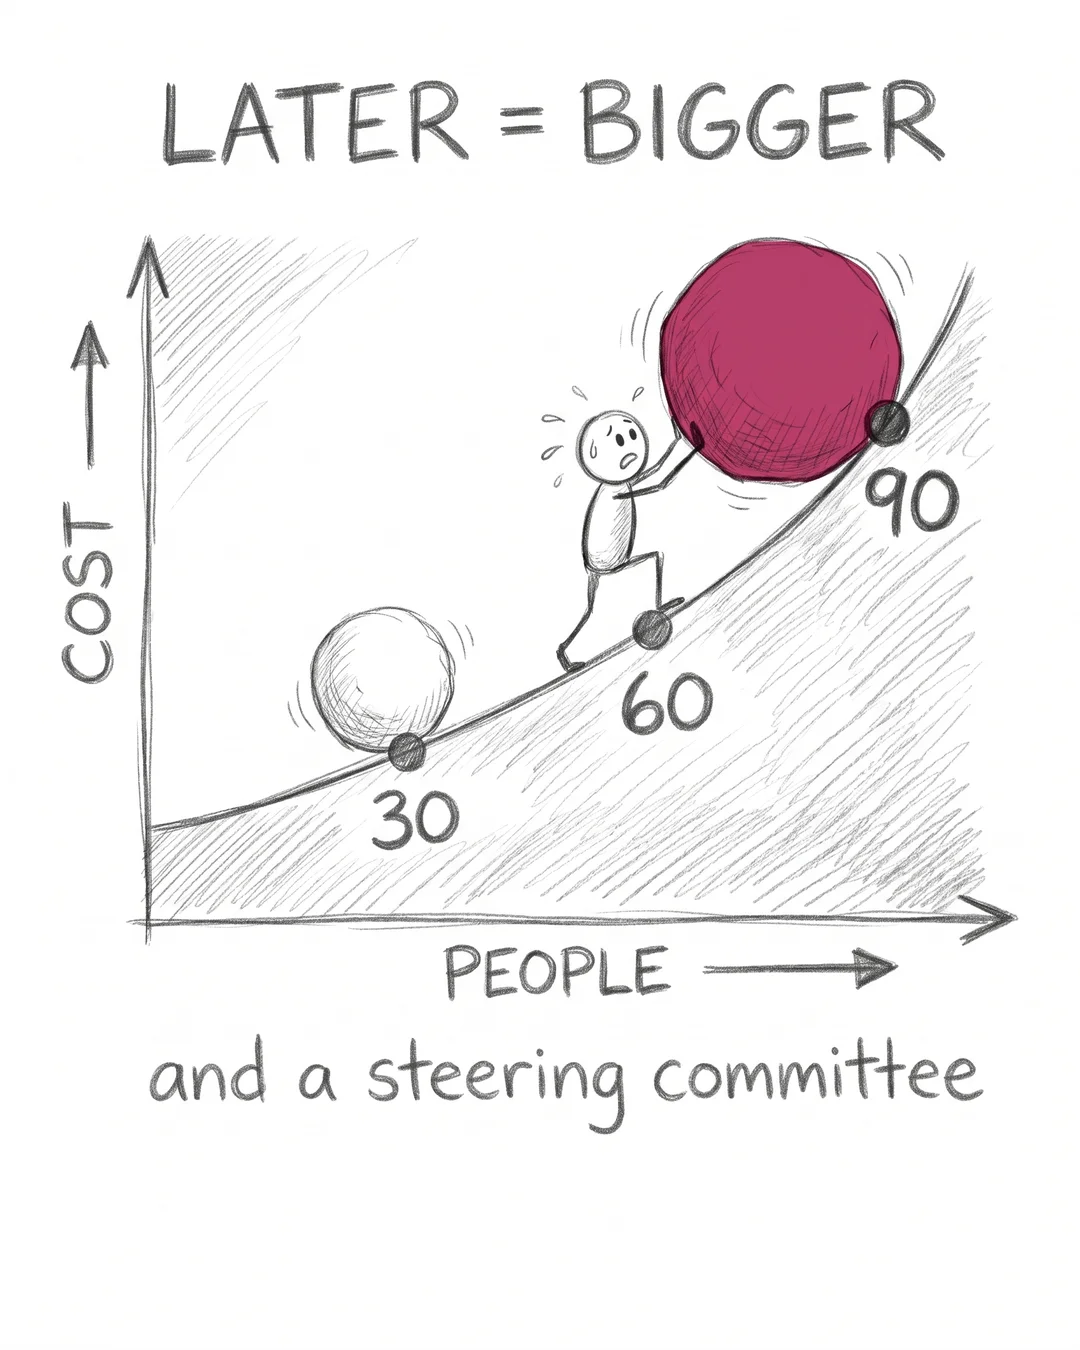
Every quarter the wrong data foundation stays in place, more of the business gets built on top of it.
New dashboards read the broken table. New hires learn the workaround as if it were the design. Someone wires a customer-facing feature to a model that was never meant to be stable.
So the cost includes the fix, everything that now depends on it and the people who have to unlearn it.
In my experience the shape repeats: the rebuild that was a six-week job at 30 people becomes a two-quarter program at 90.
To see where you are on that curve, check:
- How many dashboards or features read from the part you’d change?
- How many people would need to learn a new way of working?
- Is anything customer-facing wired to it yet?
If the third answer is yes, the curve just got steeper.
I check this in the first week of a Platform Review, because every new dependency adds to the migration.
Where is your stack on the curve? The long version: https://thomasnys.com/data-platform-scaling/
Fractional Data Architect helping startups and scaleups build data platforms that scale.
More about Thomas Nys →