T-Shaped Monitoring Model
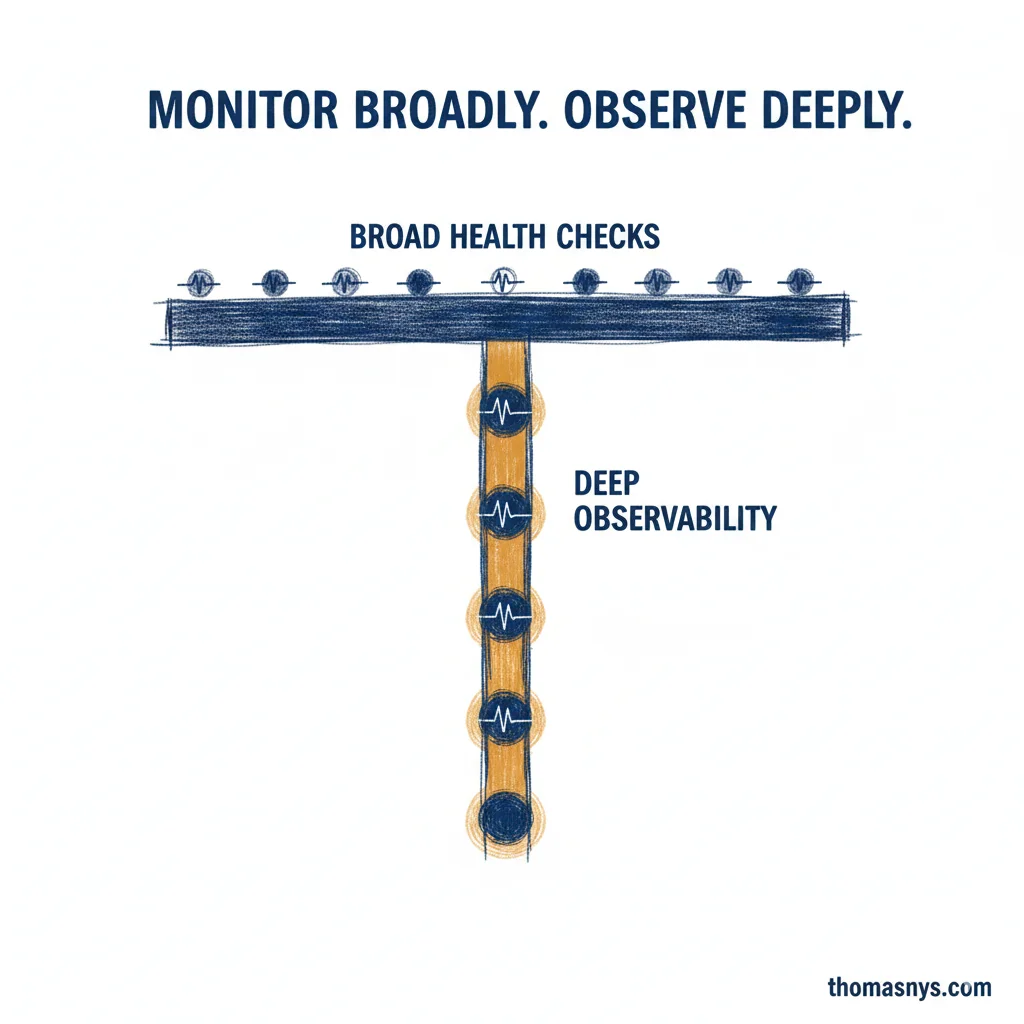
Monitoring all your data equally is why you’re drowning in alerts. Here’s the smarter approach.
A client came to me last year with 2,000 alerts per week. The team had stopped looking at them. Every alert was “high priority.” So none of them were.
Most monitoring setups treat every dataset the same - identical checks, identical thresholds, identical priority. That’s the problem. The fix wasn’t better tooling. It was a T-shaped monitoring model.
The horizontal bar: Basic health checks across everything. Freshness, volume, schema changes. Light touch. If something disappears or doubles overnight, you’ll know.
The vertical bar: Deep observability on 5-10 business-critical datasets. Anomaly detection, SLA tracking, quality scoring. The ones where failure means revenue impact, compliance exposure, or customer-facing breakage.
How do you find those 5-10? Ask: “If this broke and nobody noticed for 24 hours, what’s the business cost?” If the answer makes you uncomfortable - that’s your vertical bar. Start there. Move the rest to lightweight checks.
That client went from 2,000 alerts per week to about 120 actionable ones. Same data, same tools. Different prioritization.
I’ve changed my thinking on this over the years. I used to push for “monitor everything deeply.” That’s a recipe for alert fatigue and wasted engineering time. Monitor broadly, observe deeply - but only where it counts.
Which 5 datasets would break your business if they went down tomorrow?
Fractional Data Architect helping startups and scaleups build data platforms that scale.
More about Thomas Nys →