DORA For Data Reliability
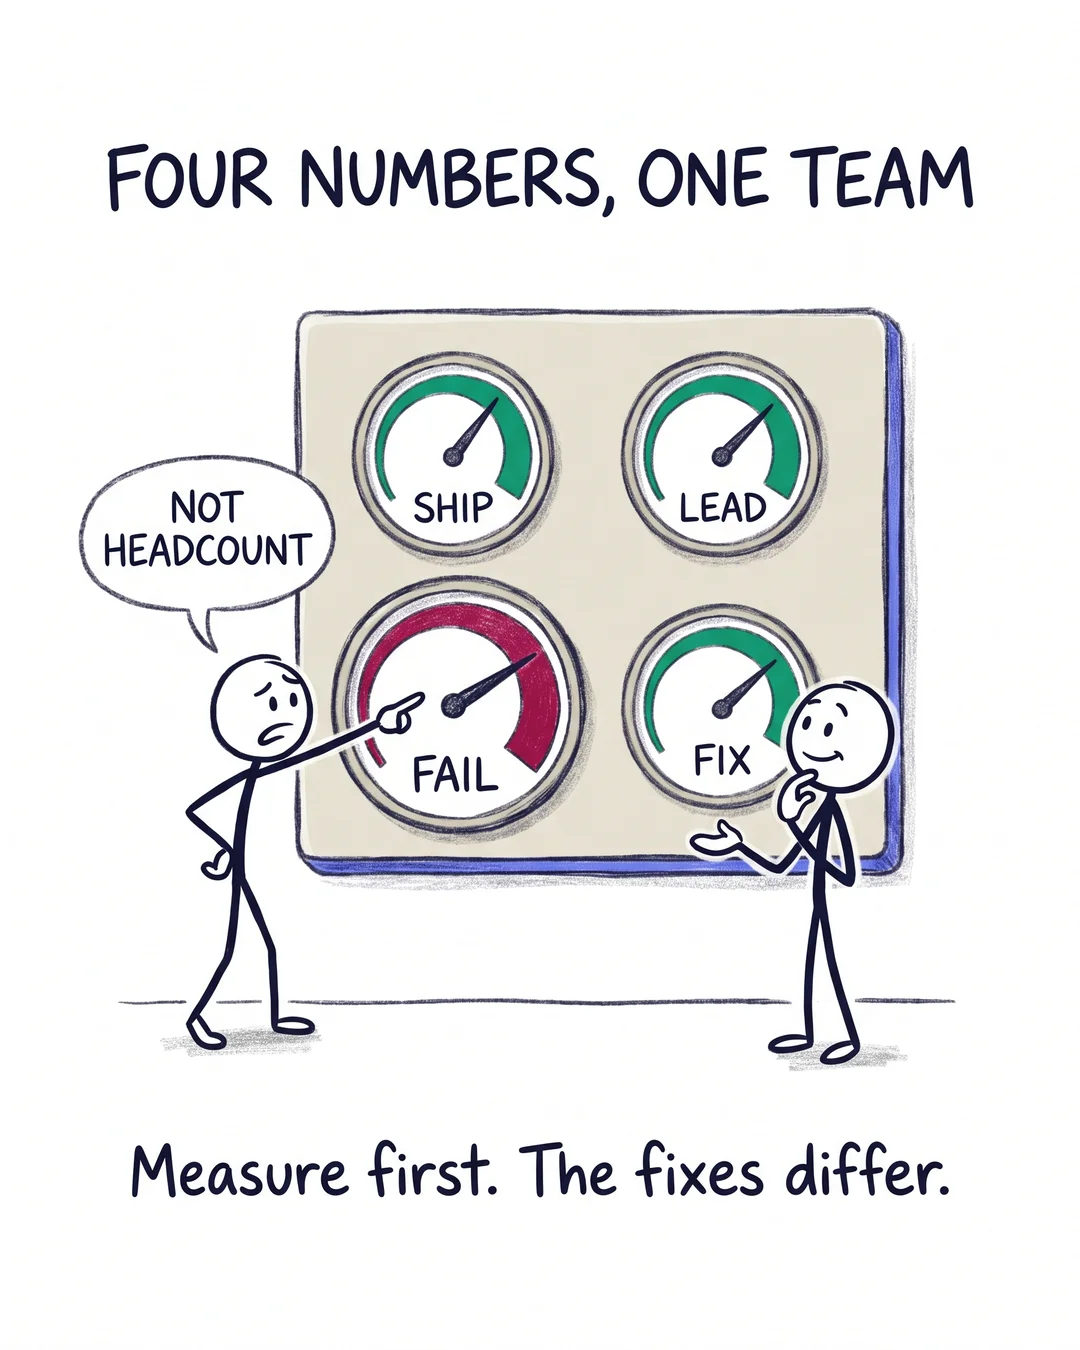
The DORA metrics are over a decade old, proven on software teams, and unused on most data teams I meet.
DORA here means the DevOps research program, not the EU regulation with the same name. Four metrics, mapped to data work:
- Deployment frequency. How often pipeline and model changes reach production. Weekly batches of changes signal fear; small daily changes signal safety nets.
- Lead time. From “we need this column” to “it’s live and documented”. Weeks here usually mean review bottlenecks, rarely lazy engineers.
- Change failure rate. What share of deploys breaks data downstream. This number ends most staffing debates, because it separates “too few people” from “no tests”.
- Time to restore. From bad data detected to trustworthy again, including backfills. The one your stakeholders actually feel.
Baseline all four in a spreadsheet from your git history and incident channel. One afternoon, in most cases.
The point of measuring: the fixes differ per metric. More headcount helps exactly one of the four, and it’s usually not the one that’s red.
Which of the four would be red on your team’s dashboard this quarter?
Written by
Thomas Nys
Fractional Data Architect helping startups and scaleups build data platforms that scale.
More about Thomas Nys →