The Short Version
A data strategy roadmap translates your data strategy from vision into action. It’s the 12-18 month plan that shows what gets built when, who builds it, and why it matters to the business.
Most roadmaps fail because they’re wish lists, not plans. They list every project someone thought would be nice to have, with no prioritization, dependencies, or capacity constraints.
A working roadmap answers three questions:
- What’s the constraint? (Team capacity, budget, or business need)
- What delivers value fastest? (Not what’s technically interesting)
- What enables everything else? (Foundation before features)
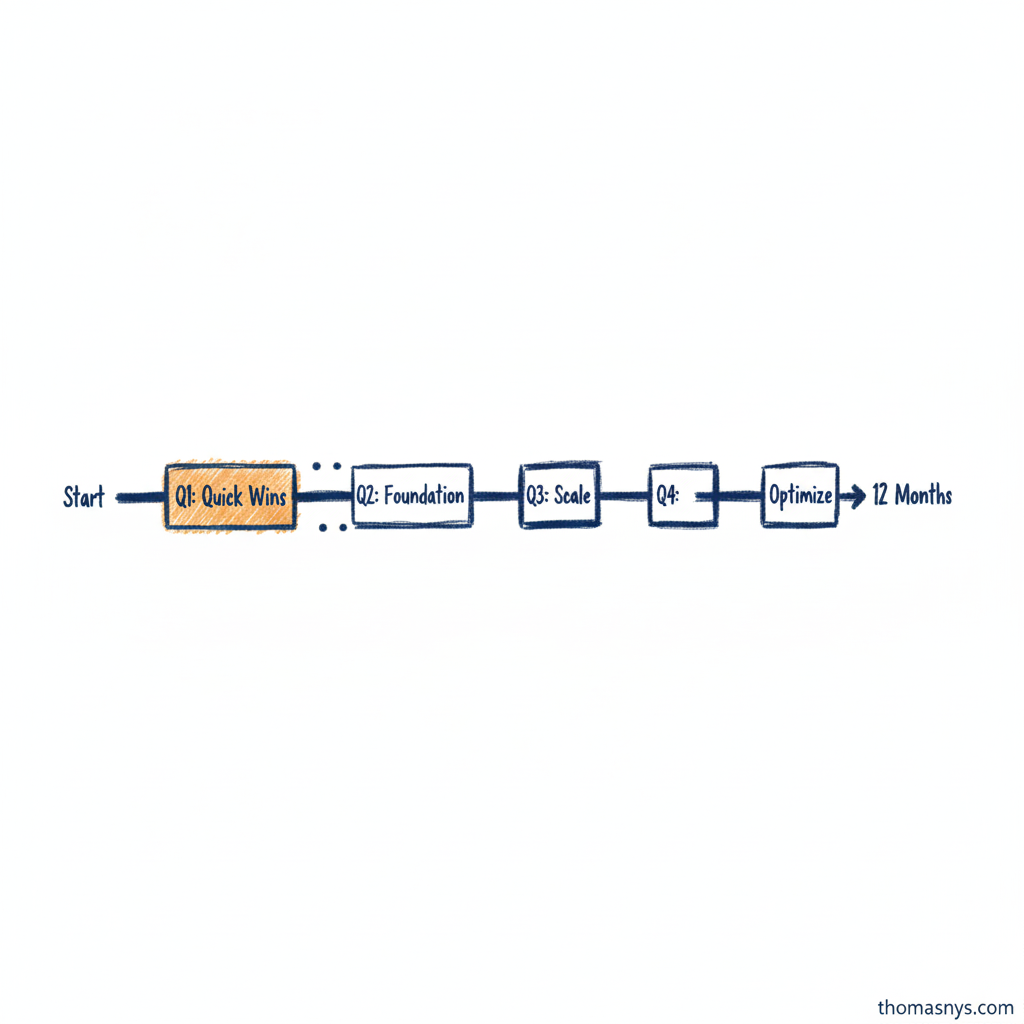
Good roadmaps ship results in the first 90 days. Great roadmaps make each quarter build on the last.
What a Data Strategy Roadmap Contains
Strategic Objectives
Where you’re going and why:
- Business outcomes data will enable (revenue growth, cost reduction, better decisions)
- Current pain points being solved (slow reports, poor quality, manual processes)
- Capabilities to build (self-service analytics, real-time data, ML infrastructure)
Objectives come from strategy. The roadmap shows how you get there.
Phases and Milestones
The sequence of work:
Phase 1 (Months 1-3): Foundation
- Address immediate pain (broken dashboards, slow queries)
- Establish basic data governance (owners, definitions)
- Set up core data architecture (warehouse, basic pipelines)
Phase 2 (Months 4-6): Core Platform
- Build reliable data pipelines
- Implement data quality monitoring
- Create self-service access
Phase 3 (Months 7-9): Advanced Capabilities
- Real-time data integration
- ML infrastructure
- Advanced analytics tooling
Phase 4 (Months 10-12): Scale and Optimize
- Expand coverage to more data sources
- Automate processes
- Cost optimization
Each phase should deliver business value, not just build infrastructure.
Prioritization Framework
How you decide what’s next:
Prioritize by:
- Business impact (revenue/cost/risk)
- Dependency (what unlocks other work)
- Effort (quick wins before long builds)
- Constraint (team capacity, budget, time)
Deprioritize:
- “Nice to have” features
- Projects without clear business owner
- Technical debt that doesn’t block delivery
- Exploratory work without hypothesis
If everything is high priority, nothing gets done.
Resource Plan
Who does what:
- Team capacity by quarter
- Key hires and when they’re needed
- External help (consultants, contractors)
- Budget allocation by initiative
Roadmaps without capacity planning are fantasies.
Success Metrics
How you know it’s working:
- Leading indicators - Data quality scores, pipeline success rates, catalog usage
- Lagging indicators - Time to insight, report accuracy, stakeholder trust
- Business outcomes - Revenue impact, cost savings, decisions accelerated
Measure progress monthly. Adjust roadmap quarterly.
Roadmap Phases Explained
Phase 1: Stop the Bleeding (Months 1-3)
Objective: Fix what’s actively broken, establish credibility
Typical initiatives:
- Fix the dashboard executives actually use
- Assign owners to critical datasets
- Document the 10 most important business definitions
- Implement quality monitoring on revenue data
- Establish data request process (so people stop emailing)
Deliverables:
- Working dashboards stakeholders trust
- Clear ownership map
- Core business glossary
- Basic quality baseline
Success criteria:
- Executives stop complaining about conflicting numbers
- Data requests resolved in days, not weeks
- Team has breathing room to plan ahead
Anti-pattern: Spend 3 months planning the perfect data platform without shipping anything.
Phase 2: Build the Foundation (Months 4-6)
Objective: Establish platform capabilities that enable future work
Typical initiatives:
- Modern data warehouse or lakehouse
- Core data integration pipelines (ETL/ELT)
- Data catalog for discovery
- Automated quality checks
- Role-based access control
Deliverables:
- Scalable data platform
- Reliable pipelines for critical data
- Self-service data discovery
- Quality monitoring in production
Success criteria:
- New data sources onboard in days, not months
- Data quality issues caught before reaching reports
- Analysts find data without asking engineers
Anti-pattern: Build the “perfect” platform that nobody uses because it’s too complex.
Phase 3: Enable Self-Service (Months 7-9)
Objective: Let stakeholders answer their own questions
Typical initiatives:
- BI tool deployment (Tableau, Power BI, Looker)
- Curated data marts for common use cases
- Training and enablement
- Expanded data coverage (more sources, more history)
- Documentation and data literacy programs
Deliverables:
- Self-service analytics environment
- Pre-built dashboards and reports
- Trained power users
- Comprehensive data documentation
Success criteria:
- 50%+ of data requests resolved through self-service
- Analysts spending time analyzing, not waiting for data
- Business users asking better questions
Anti-pattern: Give everyone access to raw tables and call it “self-service.”
Phase 4: Advanced Capabilities (Months 10-12)
Objective: Support strategic initiatives (ML, real-time, advanced analytics)
Typical initiatives:
- Real-time data pipelines (CDC, streaming)
- ML infrastructure (feature stores, model registry)
- Advanced analytics (predictive models, optimization)
- Operational analytics (real-time dashboards)
- Cost optimization and efficiency improvements
Deliverables:
- Real-time data availability
- ML experimentation platform
- Predictive models in production
- Optimized infrastructure costs
Success criteria:
- Real-time data driving operational decisions
- ML models deployed and delivering value
- Platform costs aligned with business value
Anti-pattern: Build ML infrastructure before you can reliably deliver batch analytics.
Roadmap by Company Stage
Different stages require different roadmaps.
Pre-Seed to Seed ($0-2M revenue)
Focus: Survive, then measure
Roadmap:
- Month 1-3: Basic tracking in place (product analytics, revenue metrics)
- Month 4-6: Simple dashboard showing key metrics
- Month 7-12: Enough data to raise Series A
Don’t: Build data warehouse, hire data team, implement ML
Constraint: No resources for data infrastructure
Series A ($2-10M revenue)
Focus: Make existing dashboards trustworthy
Roadmap:
- Month 1-3: Fix broken reports, assign data owners
- Month 4-6: Basic data warehouse, core pipelines
- Month 7-12: Self-service analytics for leadership
Don’t: Advanced ML, real-time infrastructure, data mesh
Constraint: Small team, limited budget
Series B ($10-50M revenue)
Focus: Scale platform to support growth
Roadmap:
- Month 1-3: Platform review, identify scaling bottlenecks
- Month 4-6: Modern data stack implementation
- Month 7-9: Data quality and governance formalization
- Month 10-12: Self-service analytics rollout
Don’t: Keep patching legacy systems, ignore governance
Constraint: Growth outpacing data infrastructure
Series C+ ($50M+ revenue)
Focus: Data as competitive advantage
Roadmap:
- Month 1-3: Architecture assessment, strategic alignment
- Month 4-6: Advanced capabilities (real-time, ML)
- Month 7-9: Scale and optimization
- Month 10-12: Enable product differentiation through data
Don’t: Neglect governance, underinvest in platform
Constraint: Complexity, legacy systems, organizational alignment
Building Your Roadmap
Step 1: Assess Current State
Understand where you are:
Run a quick assessment:
- What data do you have? (sources, volume, quality)
- What’s working? (dashboards people trust, reliable pipelines)
- What’s broken? (complaints, manual processes, data gaps)
- Who owns what? (teams, skills, capacity)
- What’s the biggest pain? (ask stakeholders)
Output: Current state documentation, pain point prioritization
Time: 1-2 weeks
Related: Platform Review
Step 2: Define Target State
Clarify where you’re going:
- What business outcomes does data enable? (be specific)
- What capabilities do you need? (self-service, real-time, ML)
- What constraints exist? (budget, team, timeline)
- What’s the acceptable quality level? (80% accuracy or 99%?)
Output: Target architecture diagram, capability requirements
Time: 1-2 weeks
Step 3: Identify Gaps
Compare current to target:
- Technology gaps - Missing platforms, tools, infrastructure
- Data gaps - Sources not integrated, quality issues, missing history
- Process gaps - No governance, unclear ownership, manual workflows
- People gaps - Missing skills, insufficient capacity, no leadership
Output: Gap analysis with estimated effort
Time: 1 week
Step 4: Sequence Initiatives
Order the work:
Prioritize based on:
- Quick wins first - Ship value in first 90 days
- Foundation before features - Build platforms before advanced use cases
- Dependencies matter - Can’t do ML without reliable pipelines
- Capacity constraints - Don’t plan more work than team can deliver
Output: Sequenced list of initiatives by quarter
Time: 1 week
Step 5: Create Timeline
Map to calendar:
For each initiative:
- Estimated effort (team-weeks)
- Dependencies (what must finish first)
- Resources needed (who, budget, tools)
- Success criteria (how we know it’s done)
- Milestones (deliverables along the way)
Output: Gantt chart or quarterly roadmap
Time: 1 week
Step 6: Get Buy-In
Socialize and refine:
- Share with stakeholders (business leaders, engineering, data team)
- Gather feedback (missing priorities, unrealistic timelines)
- Adjust based on input (but don’t let it become a wish list)
- Secure commitment (budget, headcount, executive support)
Output: Approved roadmap with committed resources
Time: 2-3 weeks
Step 7: Execute and Adapt
Ship and learn:
- Start with Phase 1 initiatives
- Review progress monthly
- Adjust roadmap quarterly based on learnings
- Communicate changes clearly
Output: Working data platform, evolving roadmap
Time: 12-18 months
Common Roadmap Mistakes
Mistake 1: Building for Tomorrow’s Scale
What happens: Design for 100x growth when you’re at 10 users.
Result: Over-engineered platform, delayed delivery, wasted budget.
Fix: Build for next 12 months, design for flexibility.
Mistake 2: Technology Before Strategy
What happens: Pick tools (Snowflake! Databricks! dbt!) before understanding requirements.
Result: Wrong tools for actual needs, high costs, team frustration.
Fix: Define what you need to do, then choose technology.
Mistake 3: No Quick Wins
What happens: Everything is a 6-month project.
Result: Team loses momentum, stakeholders lose faith, roadmap gets canceled.
Fix: Ship value in first 90 days. Quick wins buy time for longer builds.
Mistake 4: Ignoring Dependencies
What happens: Plan ML platform before basic pipelines work.
Result: Projects blocked, timelines slip, team context switches.
Fix: Build foundation first. Advanced capabilities last.
Mistake 5: Capacity Fantasy
What happens: Roadmap assumes team can deliver 3x current capacity.
Result: Everything slips, quality suffers, burnout.
Fix: Plan for 60-70% of theoretical capacity. People need slack.
Mistake 6: Set and Forget
What happens: Create roadmap in January, don’t revisit until December.
Result: Roadmap diverges from reality, becomes irrelevant.
Fix: Review monthly, adjust quarterly, communicate changes.
Roadmap Governance
How to keep the roadmap honest:
Monthly Review
What to check:
- Progress vs plan (are initiatives on track?)
- Blockers and risks (what’s slowing things down?)
- Resource utilization (is team over/under capacity?)
- Metric trends (are we moving the right numbers?)
Output: Status update, minor adjustments
Participants: Data leadership, project leads
Time: 1 hour
Quarterly Planning
What to revise:
- Initiative priorities (what changed in business?)
- Timeline adjustments (based on actual velocity)
- Resource allocation (hire, contractor, or delay?)
- Success metrics (are we measuring the right things?)
Output: Updated roadmap for next quarter
Participants: Data leadership, stakeholders, exec sponsor
Time: Half day
Annual Strategy Refresh
What to rethink:
- Strategic objectives (still aligned with business?)
- Target architecture (still the right destination?)
- Investment levels (increase, maintain, reduce?)
- Team structure (right roles for roadmap?)
Output: Next year’s roadmap
Participants: Full leadership team
Time: Full day workshop
When to Get External Help
Build roadmap internally if:
- You have experienced data leadership
- Clear understanding of business priorities
- Team consensus on priorities
Get data architect consultant help if:
- First time building data strategy roadmap
- Stakeholders can’t agree on priorities
- Need external validation before committing budget
- Technical decisions require expertise you lack
A fractional data architect can own roadmap execution - designing, building, and adapting the plan as you learn. For roadmap reviews and strategic guidance, architecture advisory provides focused input.
The value isn’t just the roadmap document - it’s avoiding the year you waste building the wrong things.
Related Reading
Strategy & Planning
- What Is Data Strategy? - The plan the roadmap implements
- What Is Data Architecture? - Technical foundation for strategy
- Data Platform Scaling - When platforms need evolution
- Why Data Architecture Matters for Startups - When to invest in architecture
Implementation
- What Is Data Governance? - Governance within strategy
- Data Governance Framework - Structured approach to governance
- Data Architecture vs Data Modeling - Understanding the distinction
- What Is Data Integration? - Core capability to build
- What Is Data Quality? - Quality standards and measurement
Challenges
- 40% Maintaining, 20% Innovating - Capacity planning reality
- Why More Developers Won’t Fix Delivery Problems - Resource constraints
- How Poor Architecture Turns Seniors Into Firefighters - Cost of no strategy
Frequently Asked Questions
What is a data strategy roadmap?
How do you create a data strategy roadmap?
What should be in a data roadmap?
How long should a data strategy roadmap be?
What's the difference between data strategy and data roadmap?
Get Started
If you’re building a data strategy roadmap and want to validate your approach, book a 30-minute call to discuss your plan.
No pitch - just an honest assessment of whether your roadmap will deliver results or needs adjustment.
Last updated: 6 April 2026