At a Glance
Data platform architecture is the design of how data moves through your organization: which layers exist, what each one is responsible for, and where the boundaries between them sit.
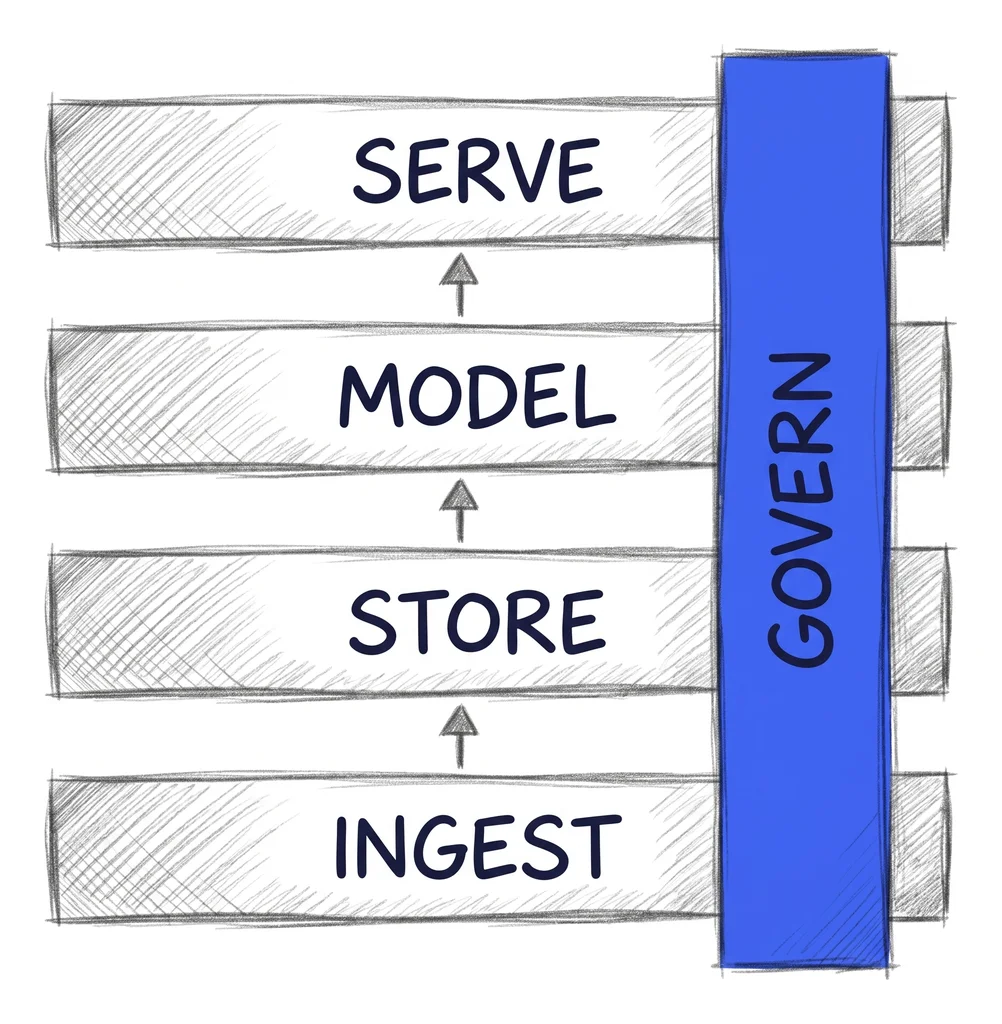
Almost every data platform, from a two-person startup to a bank, resolves into five layers:
- Ingestion - getting data out of source systems
- Storage - where it lands and how it’s laid out
- Transformation - turning raw data into modelled, trustworthy tables
- Serving - how people and applications consume it
- Governance and observability - cutting across all four rather than sitting under them
The layers don’t change with company size. What changes is how much machinery each one needs. A 25-person company and a 2,500-person company both need ingestion; one needs Fivetran and a cron, the other needs a self-service ingestion framework with SLAs. Most of the expensive mistakes I see come from a team copying the second architecture at the first company’s scale.
For the definitional version, what is a data platform covers what a platform is and whether to build or buy one. Everything below is about designing it.
The Layers of a Data Platform Architecture
1. Ingestion
Moving data from source systems into the platform. Application databases, SaaS APIs, event streams, files someone drops in a bucket.
The decisions that matter:
- Batch, incremental or streaming per source, not per platform. Most sources are fine on a daily or hourly batch. A handful genuinely need seconds.
- Buy or build per connector. Managed connectors (Fivetran, Airbyte, Stitch) are expensive per row and cheap per engineer-hour. The break-even moves with volume, and it moves fast, so recheck it yearly rather than deciding once.
- Extract raw, transform later. Land the source shape untouched, then transform. Transforming during ingestion couples the two and makes a backfill a rewrite.
- Schema drift handling. What happens when a source adds a column, or changes a type. Silent failure here is the most common cause of a number that’s quietly wrong for three weeks.
2. Storage
Where the data lives and how it’s physically organized.
- Object storage or warehouse-native tables. Object storage plus an open table format (Iceberg, Delta) keeps the data portable and the compute swappable. Warehouse-native is simpler and locks you in further. Both are defensible.
- Zone layout. Raw, staged, modelled. The names vary; the separation shouldn’t. Raw is immutable and never queried by analysts. Modelled is what people use.
- Partitioning and file layout. The single largest lever on both query cost and query speed, and the one most often left at defaults.
- Retention. Raw data is cheap until it isn’t. Decide a retention policy at design time; it’s a much harder conversation once compliance has an opinion.
3. Transformation
Raw data becomes tables people can trust. In practice this is where most of the engineering effort goes and where most of the architectural discipline shows.
- ELT over ETL for anything warehouse-based. Push the compute to the warehouse, keep the logic in version-controlled SQL.
- One transformation framework, not three. dbt or SQLMesh or the warehouse’s own, but one. Split logic across a framework, some stored procedures and a notebook, and nobody can answer where a number is defined.
- Testing at the layer boundary. Uniqueness, not-null, referential integrity and freshness tests at the point raw becomes modelled. This is what stops bad data propagating into 40 dashboards.
- Layered models. Staging (renamed and typed, one model per source table), intermediate (business logic), marts (what analysts query). The medallion naming for the same idea is bronze/silver/gold.
4. Serving
How the modelled data reaches the people and systems that need it.
- BI and dashboards for the majority of consumption.
- Reverse ETL when operational systems need the modelled data back: pushing a computed customer health score into the CRM.
- APIs or a semantic layer when applications, not people, are the consumer, or when metric definitions need to be consistent across several BI tools.
- Direct warehouse access for analysts, which is fine and should be governed rather than prevented.
The architectural question here is where metric definitions live. If “active customer” is defined in four dashboards, you have four definitions. A semantic layer or a modelled marts layer is how you get to one.
5. Governance and Observability
Two concerns that apply to all four layers above, which is why platforms that bolt them on at the end struggle.
- Access control - who can read what, ideally by role and enforced in one place rather than per tool.
- Cataloguing - what exists, what it means, who owns it.
- Lineage - what breaks downstream when something changes.
- Quality monitoring - freshness, volume, schema drift, distribution shifts, with alerts that reach someone who can act.
- Cost attribution - which team’s queries produced this month’s bill. Absent this, warehouse cost is nobody’s problem until it’s the CFO’s.
Reference Architectures by Company Stage
Three shapes cover most of what I see.
10 to 30 people: one warehouse, one framework
Managed ingestion for 5 to 15 sources. A single cloud warehouse. dbt for transformation. One BI tool. Orchestration by the warehouse scheduler or a managed service, not self-hosted Airflow.
No streaming, no lakehouse, no catalogue tool, no data team org chart. Two engineers can run this and it will carry the company to 100 people if the modelling discipline holds. Total platform cost is usually low four figures a month.
The failure mode at this stage is over-building: a team hires an engineer from a large company who builds the architecture they know, and the company now pays for a Kubernetes-hosted orchestrator serving 12 daily jobs.
30 to 100 people: separated zones and real governance
Same five layers, more structure under each. Object storage plus an open table format under the warehouse, so raw data isn’t trapped. Zone separation enforced by permissions, not convention. A real orchestrator. Freshness and quality tests wired to alerts. A catalogue once the table count passes a few hundred. Cost attribution by team.
Streaming appears here if, and only if, there’s a use case that genuinely can’t tolerate a 15-minute lag. Fraud checks and live operational dashboards qualify. Executive reporting does not.
100+ people: multiple teams, platform as a product
The shift at this stage is organizational. Several teams now produce and consume data, and the central data team approving everything becomes the bottleneck.
What changes: self-service ingestion and transformation with guardrails, domain ownership of modelled data, data contracts at the boundaries between producers and consumers, an internal platform team whose users are other engineers. This is the point where data mesh ideas start earning their complexity. Below it they almost never do.
More on the progression in data platform scaling .
Batch vs Streaming
The most over-decided question in platform architecture.
Batch is cheaper, simpler to reason about, easier to backfill and easier to test. Streaming costs more in infrastructure and considerably more in engineering attention, because a streaming pipeline that’s wrong is wrong continuously and a backfill is a genuine project.
Decide per use case, on latency the business will actually act on:
- Daily covers most reporting.
- Hourly covers most operational dashboards.
- Minutes covers near-real-time operational needs, usually with micro-batching rather than true streaming.
- Seconds is for fraud detection, live personalization, and a short list of things where a human or a system acts immediately.
A useful test: ask what someone would do differently if the number arrived 30 minutes earlier. If the honest answer is nothing, batch it.
Warehouse-Centric, Lakehouse, or Hub-and-Spoke
Three architectural shapes, in the order most companies should consider them.
Warehouse-centric. Everything lands in one cloud warehouse; storage and compute are the vendor’s problem. Simplest to operate, best tooling support, and sufficient for most companies under 100 people. The tradeoff is portability and cost at high volume.
Lakehouse. Object storage plus an open table format, with warehouse-like query engines on top. Keeps data portable, handles unstructured and ML workloads natively, and costs more operational attention than the vendor demos suggest. Worth it when volumes are large, workloads are mixed, or lock-in is a board-level concern.
Hub-and-spoke. A central modelled core with domain-owned marts around it. This is an organizational pattern more than a storage one, and it’s the answer to a coordination problem, not a technology problem.
Which warehouse or lakehouse engine to run under any of these is a separate question, covered in Snowflake vs BigQuery vs Databricks .
Common Architecture Failure Modes
The five I see most often, in order of how expensive they are to unwind.
Transformation logic scattered across layers. Some in ingestion, some in SQL models, some in the BI tool, some in a notebook. Nobody can trace a number. This is the most expensive one because fixing it means re-deriving every metric.
No raw layer. Transforming on the way in means a logic change requires re-extracting from source, which is sometimes impossible. Keep raw immutable.
Governance bolted on. Access control per tool, definitions in a spreadsheet, no lineage. Retrofitting this across a live platform is 6 to 12 months of work that produces no new capability.
Built for a scale that never arrived. Streaming for daily reporting, Kubernetes for 12 jobs, a mesh for one team. Two engineers then spend their week on platform operations instead of on data, which costs more than the infrastructure bill ever will.
One person who understands the whole thing. An architecture nobody else can hold in their head is a single point of failure regardless of how good it is.
How to Document It
Architecture that only exists in someone’s head isn’t architecture. Two artefacts carry most of the weight, and both need to be small enough to stay current.
One diagram showing the five layers, the actual tools in each, and the flow between them. One page. If it doesn’t fit on a page, the platform has structure worth simplifying. Update it when a tool changes, which is rare enough to be manageable.
Architecture decision records. One short document per significant decision: what was decided, what the alternatives were, what constraints drove it, and what would make you revisit. A page each. Six months later, when someone asks why you’re not on the other warehouse, the answer exists and is honest about its assumptions.
Everything else (runbooks, model documentation, data dictionaries) belongs in the tools that generate it, not in a wiki that goes stale. See what is a data catalog for where definitions should live.
If you’re working inside a formal enterprise architecture framework, the equivalent artefacts are Phase C deliverables. TOGAF data architecture covers what those are and who owns them.
Frequently asked
What is data platform architecture?
What are the layers of a data platform architecture?
What data platform architecture does a 30-person company need?
Should a data platform use batch or streaming?
What is the difference between a data platform and data platform architecture?
What is the most common data platform architecture mistake?
Related Reading
- What Is a Data Platform? - The definitional guide, and build vs buy
- Data Platform Scaling - What changes as the company grows
- What Is Data Architecture? - The broader discipline this sits inside
- Snowflake vs BigQuery vs Databricks - Picking the engine under the architecture
- What Is a Data Catalog? - Where definitions and ownership live
- TOGAF Data Architecture - The same work inside a formal EA framework
- Data Architecture Principles - The decisions that should hold across every layer
- Data Platform Assessment Checklist - Auditing an architecture you inherited
Last updated: 15 September 2026
Fractional Data Architect helping startups and scaleups build data platforms that scale.
More about Thomas Nys →